 |
|
|
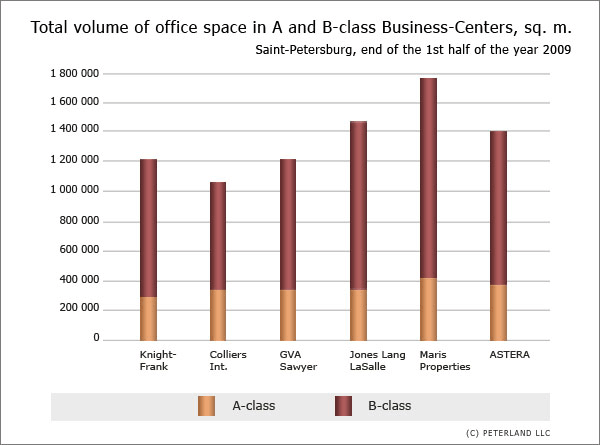
CONDITION OF COMMERCIAL REAL ESTATE MARKET OF SAINT-PETERSBURG: 1ST HALF OF 2009 Since the year 2009 PETERLAND has been monitoring the offers for the construction of commercial real estate, basing on surveys conducted by our specialists. In contrast to such surveys this brief review depicts the condition of the market of existing, i.e. already constructed and operational objects of commercial property. This review contains the summary of commercial real estate market indices of Saint-Petersburg, obtained in the result of surveys conducted by the leading consulting and realtor companies, operating on this market. The main purpose of such consolidated reviews is to get answers to such simple questions as: How many commercial property objects are there in Saint-Petersburg? How many of them are in use, and how many new ones are under construction? What is the occupancy rate of commercial floor space? What are the market needs? Prices? Rental rates? In the result of regular publications of main indices of Saint-Petersburg commercial property market, one may get an insight into the existing situation and trace the primary trends of this market. This shall undoubtedly be useful for both analysts and developers and investors studying the issues on the construction of new objects and investment into new projects. This will prove to be especially useful when comparing two sections: market of offers and market of existing objects. It is proposed to publish such consolidated data (kind of informational profiles) twice a year – in the end of every six months. Review object The following segments of Saint-Petersburg commercial property market have been studied: 1. Office property. Information sources used The information about some segment of the market or another can be found in public sources pretty often, but it should be noted that such information is rather fragmentary, sketchy and poorly systematized. Moreover not all companies, who publish such reviews, make them available to the general public. Thus it proved to be uneasy to make the adequate overview on the market. In order to make the consolidated review of the commercial property market of Saint-Petersburg the data of the leading consulting companies such as: Knight Frank, Colliers International, GVA Sawyer, Jones Lang LaSalle, Maris Properties, ASTERA, were used as the most complete and more or less systematized ones. These date were published in the mass media, special printing matters or were available on the Internet. The summary figures of Saint-Petersburg commercial property market for the 1st six months of 2009, obtained from the said sources are given below in tables and on diagrams. Whereas the direct data on some indices were missing in one source or another, such indices were obtained through recalculation of figures taken from the said sources. 1. Office property The major figures on office property in A and B-class Business-Centers are given below:  One may see from the table that the major figures may vary. For illustration, the total volume of office space in A and B-class Business-Centers subdivided by classes is shown on Diagram 1. Diagram 1
 2. Retail property As per data by Colliers International at the end of June 2009 there were 148 large retail objects (with floor space for rent not less than 4000 sq.m.) operating in Saint-Petersburg. Below one can find major figures on retail space in shopping centers and malls, multipurpose centers and hypermarkets of different types.  In this table the major figures also vary considerably. This could have been due to the vast variety of shopping centers of different formats that hinders the unification of retail space calculation. The total volume of retail space is given in Diagram 2 below for illustration. Diagram 2
 3. Warehousing property Figures on A and B-class warehouses are provided in table below.  For illustration, the total volume of warehousing space subdivided by classes is shown on Diagram 3. Diagram 3
 Conclusion As you can see from the results given above, the major figures of commercial property markets, obtained from reviews by different companies, may vary considerably. Most probably, this is because the object of surveys is not the same all the time. Unfortunately in reports and reviews being published the object is not always stated clearly; neither do its selection criteria. We may only hope that despite all this, this summary gives the insight into the market of operational commercial property of Saint-Petersburg. Indemnity against liability This review is for reference only. It contains data received from the open sources and depicts figures, stated in reports and overviews of the mentioned companies. Therefore, PETERLAND bears no responsibility for the accuracy and reliability of such data. |
|